Commercial buildings are entering a difficult charging decade. Tenants want reliable workplace charging, while fleets need predictable departure times. Electricity demand also arrives in sharp peaks. A poorly planned DC system can overload transformers, increase demand charges, and leave drivers waiting beside half-used parking spaces.
The International Energy Agency reported in Global EV Outlook 2024 that public charging infrastructure expanded by more than 40% in 2023. It also noted rapid growth in fast-charging deployment. The U.S. Department of Energy’s Alternative Fuels Data Center highlights managed charging as a practical way to reduce peak demand and coordinate vehicle loads. These findings shape how to optimize dc charging for commercial buildings: measure arrival patterns, assess feeder capacity, select appropriate charger power, and schedule energy intelligently.
Chris Nelder, an electric mobility and grid-integration specialist, has stated, “Electric vehicles are not a problem for the grid; they are a solution to the grid.” The principle is useful, but it needs qualification. A charging hub cannot solve every building constraint. Software cannot replace a transformer study. Real projects require interval-meter data, load forecasting, utility coordination, and careful commissioning. Small details matter: a 150-kilowatt charger beside a lunchroom may create a sharp midday peak. A 60-kilowatt shared system may serve more vehicles with less stress. Perhaps the best design is not the fastest one. It is the one that delivers dependable charging without wasting capacity, money, or valuable parking space. This guide examines those decisions through operational evidence, engineering practice, and credible industry research.
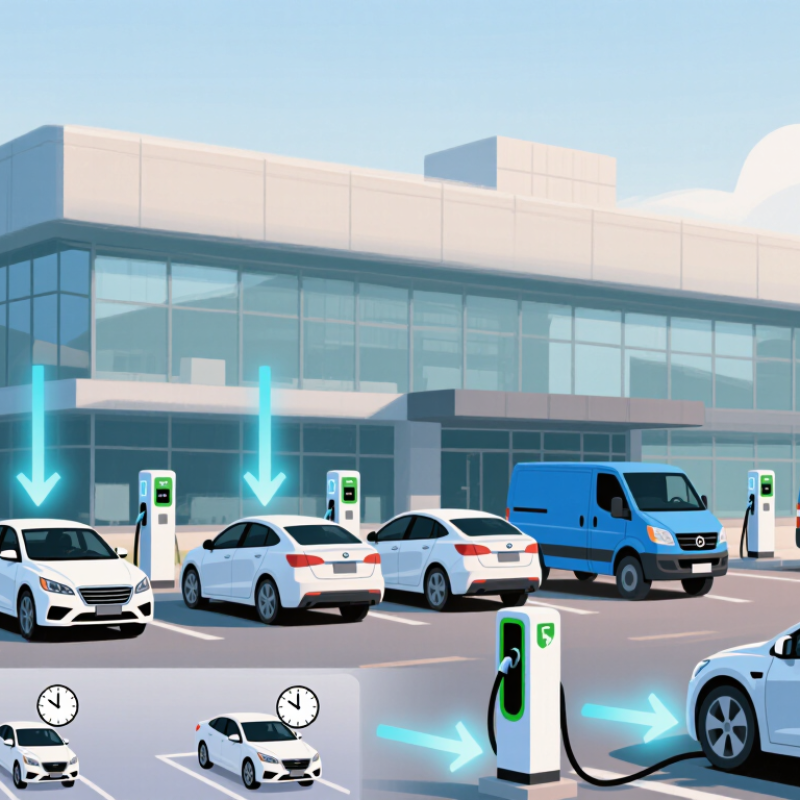
How to Optimize DC Charging for Commercial Buildings?
Assessing a commercial building’s energy needs is the practical starting point for DC charging. Review electricity bills, transformer capacity, panel space, and the building’s hourly load profile. A charger may operate at full power during lunch, when cooling systems and elevators already demand significant energy. That overlap can create expensive peaks and reduce charging availability. Measure real usage for several weeks, rather than relying on a single monthly bill. Field assessments often reveal unexpected overnight loads. They also expose outdated assumptions.
Define the charging goal in measurable terms. Is the site supporting employee vehicles, delivery fleets, visitors, or emergency top-ups? Record arrival times, parking duration, battery sizes, and the energy each vehicle typically needs. A fleet leaving at 7:00 a.m. needs a different strategy from visitors staying for four hours. Set a target, such as adding 150 kilowatt-hours before departure. Then compare that target with available electrical capacity. Our first estimate may be too optimistic. Recheck it against winter heating and summer cooling demand.
Tips: Start with a load study and a clear charging schedule. Consider load management before requesting major electrical upgrades. Keep reserve capacity for building operations. Test the plan during the busiest hour. Document every assumption, including vehicle turnover and charging losses. Small measurement errors can become large infrastructure costs. Review the results with a qualified electrical professional and the local utility before construction.
This planning profile compares a typical commercial building’s weekday electricity demand with a coordinated DC charging schedule. Charging is concentrated during lower-demand periods and reduced during the building’s late-morning peak to help keep total site demand below an 800 kW operating limit.
DC charging begins with the building’s electrical reality. Review the utility service rating, transformer capacity, switchgear limits, and spare breaker positions. A 480-volt service may appear sufficient, yet a crowded panel can leave little usable capacity. Check cables, protection settings, ventilation, and available space near the proposed charging area. Physical distance matters because long cable runs increase installation cost and voltage drop.
Study the building’s load profile in 15-minute intervals. Compare office equipment, elevators, HVAC systems, refrigeration, and lighting across weekdays and weekends. A charging system that looks manageable at noon may create a sharp demand peak when vehicles return at 5 p.m. Meter data is more reliable than assumptions. Early estimates are often too optimistic.
Charging demand should match vehicle schedules, not only battery size. Record arrival times, departure deadlines, daily mileage, and required energy per vehicle. A delivery fleet may need rapid charging, while employee vehicles can charge slowly during extended parking. Use managed charging to stagger sessions and protect available capacity. Set practical power limits during HVAC peaks. The schedule may need adjustment.
Leave room for uncertainty. Fleet growth, colder weather, and delayed departures can change demand quickly. A useful design includes spare capacity, clear monitoring, and alarms for abnormal loads. Recheck the model after installation, because real operating behavior rarely follows the first spreadsheet.
How to Optimize DC Charging for Commercial Buildings?
Selecting DC charging equipment starts with the building’s actual traffic pattern, not its maximum dream scenario. The IEA’s Global EV Outlook 2024 reports over four million public charging points worldwide at the end of 2023. Public charger additions also increased by more than 40% that year. This growth makes equipment selection a power-planning decision. Choose chargers according to vehicle dwell time, charging targets, and daily turnover. A 60 kW unit may suit offices, while logistics sites may require 150 kW or higher. Confirm output voltage, connector compatibility, efficiency, cooling method, and maintenance access. Avoid judging equipment only by its nameplate rating.
The power distribution system needs a realistic load study. Calculate simultaneous charging demand, building loads, transformer capacity, short-circuit levels, and voltage drop. Include harmonic distortion and power-factor performance. Dynamic load management can reduce peak demand by allocating available power between chargers. Separate feeders, suitable protection, emergency shutdowns, and clear cable routes improve operational safety. The National Renewable Energy Laboratory has repeatedly highlighted the importance of coordinated charging and managed demand in reducing infrastructure stress. Some early designs oversize everything. That feels safe, but it can waste capital and space.
Tips: Measure site load data for at least two weeks. Reserve space for future switchgear and transformers. Test charging performance during the building’s busiest hour. Review the design with a licensed electrical engineer. Recheck assumptions annually. Traffic rarely stays predictable.
| Design Dimension | Reference Value or Option | Electrical Calculation / Requirement | Recommended Application | Design Considerations |
|---|---|---|---|---|
| DC charger output power | 30–60 kW | Suitable for moderate dwell times and scheduled fleet charging. | Offices, workplaces, hotels, and small commercial parking facilities. | Lower impact on the building transformer and easier integration with existing low-voltage distribution systems. |
| DC charger output power | 90–180 kW | Provides faster charging for vehicles with compatible battery and charging limits. | Retail centers, logistics depots, public parking, and mixed-use commercial buildings. | Requires stronger feeders, larger overcurrent protection, and careful coordination with the building demand profile. |
| DC charger output power | 240–360 kW | High-power charging for short dwell times and high vehicle turnover. | Transport hubs, highway-adjacent facilities, heavy-duty fleet sites, and large charging plazas. | May require medium-voltage service, a dedicated transformer, power-quality analysis, and utility approval. |
| Nominal AC input voltage | 400 V, three-phase | Common low-voltage commercial distribution level in many regions. | Buildings supplied by 400/230 V three-phase systems. | Confirm the local utility voltage, earthing arrangement, short-circuit rating, and equipment compatibility. |
| Nominal AC input voltage | 480 V, three-phase | Common commercial distribution level in some regions. | Commercial and industrial facilities supplied by 480/277 V systems. | Higher voltage reduces feeder current for the same power, but all equipment must be rated for the applicable system voltage. |
| Typical charger efficiency | Approximately 94–97% | Input power is higher than rated DC output power because of conversion losses. | Use the manufacturer-certified efficiency curve for final design. | Thermal losses increase electrical demand and cooling requirements, especially at high continuous output. |
| Power factor | Approximately 0.95–0.99 | Three-phase current can be estimated using: I = Pin ÷ (√3 × V × PF). | Use the certified charger power-factor range for feeder and transformer calculations. | Low power factor increases current, voltage drop, and apparent-power demand. |
| Estimated input current at 50 kW DC | About 74 A at 400 V; about 61 A at 480 V | Assumes 95% efficiency and 0.98 power factor. | Small commercial installations and moderate-duty charging. | Final conductor and protective-device sizing must follow local electrical codes and equipment documentation. |
| Estimated input current at 150 kW DC | About 221 A at 400 V; about 184 A at 480 V | Assumes 95% efficiency and 0.98 power factor. | Medium-duty commercial and fleet charging. | Consider a dedicated distribution panel and load-management controls when multiple chargers operate simultaneously. |
| Estimated input current at 240 kW DC | About 353 A at 400 V; about 294 A at 480 V | Assumes 95% efficiency and 0.98 power factor. | High-turnover charging locations. | Check feeder ampacity, voltage drop, thermal derating, busbar capacity, and available fault current. |
| Estimated input current at 360 kW DC | About 530 A at 400 V; about 442 A at 480 V | Assumes 95% efficiency and 0.98 power factor. | Large charging plazas and high-power fleet operations. | A dedicated transformer or medium-voltage connection may be more practical than extending an existing building feeder. |
| Continuous-load planning | Use the charger’s maximum continuous input demand | EV charging is commonly treated as a continuous load; apply the locally required continuous-load factor. | All commercial DC charging installations. | Do not size the distribution system only from nominal DC output. Include conversion losses and control-system demand. |
| Illustrative feeder rating for 50 kW DC | Approximately 100 A at 400 V | Illustrative only: 74 A calculated current multiplied by a 125% continuous-load factor and rounded to a standard rating. | Single 50 kW charger under the stated assumptions. | Actual breaker, conductor, and disconnect ratings depend on local code, installation method, ambient temperature, and terminal ratings. |
| Illustrative feeder rating for 150 kW DC | Approximately 300 A at 400 V | Illustrative only: 221 A calculated current multiplied by a 125% continuous-load factor and rounded to a standard rating. | Single 150 kW charger under the stated assumptions. | Verify whether the charger has an internal input breaker and whether upstream selective coordination is required. |
| Transformer capacity planning | Calculate in kVA, not only kW | Approximate apparent power: S = Pin ÷ PF. | Sites with multiple chargers or limited utility capacity. | Include existing building peak demand, charger diversity, future expansion, transformer loading limits, and spare capacity. |
| Example: four 150 kW chargers | 600 kW maximum DC output | At 95% efficiency and 0.98 PF: approximately 645 kVA before diversity or load management. | Medium-sized fleet or public charging site. | Actual service capacity must also include the building’s coincident peak load and any planned expansion. |
| Load management | Dynamic power allocation among chargers | Limits aggregate demand to a programmed site power ceiling. | Buildings with constrained transformer or utility capacity. | Prioritize vehicles by departure time, state of charge, fleet route, or operational importance. |
| Demand response readiness | Adjustable charging schedule and power setpoints | Charging can be shifted away from utility peak periods when permitted. | Commercial buildings with time-of-use tariffs or demand charges. | Maintain minimum charging requirements and ensure controls cannot interrupt safety functions. |
| Voltage-drop target | Keep feeder and branch-circuit voltage drop within local code and engineering limits | Longer runs and higher currents require larger conductors or higher distribution voltage. | Remote parking areas and large campuses. | Evaluate starting conditions, continuous operation, conductor temperature, and charger operating tolerances. |
| Harmonic performance | Verify total harmonic distortion and input-current quality | Power-electronic chargers can affect building power quality. | Facilities with sensitive equipment, generators, or a weak electrical grid connection. | Request certified harmonic data and assess interaction with capacitors, UPS systems, generators, and other converters. |
| Protection and coordination | Overcurrent, short-circuit, ground-fault, and surge protection | Protection devices must match available fault current and equipment withstand ratings. | Every charger and distribution architecture. | Perform a short-circuit study and coordination review where required by the authority having jurisdiction. |
| Environmental rating | Indoor, outdoor, wet-location, dust, and temperature ratings as applicable | Enclosures and connectors must suit the installation environment. | Open-air parking, loading areas, garages, and coastal or dusty locations. | Account for rain, flooding, salt exposure, snow, solar heating, ventilation, and cable-management requirements. |
| Maintenance access | Provide clear working space and safe isolation points | Electrical working clearances and access routes must comply with local regulations. | All commercial installations. | Allow access for filter replacement, cooling-system service, cable inspection, firmware updates, and emergency shutdown. |
| Future expansion | Reserve approximately 20–30% planning capacity where practical | Reserve capacity may include spare feeder space, transformer margin, conduit, switchgear sections, and communications pathways. | Sites expected to add chargers or larger vehicle fleets. | Confirm the expansion allowance through a load forecast rather than applying a fixed percentage without analysis. |
| Recommended design sequence | Assess demand → select charger class → calculate input load → design distribution → verify protection → commission controls | Use measured building demand where available and model simultaneous charging scenarios. | New construction, retrofit, and phased deployment projects. | Coordinate electrical, civil, structural, networking, fire-safety, accessibility, and utility requirements from the beginning. |
| Reference assumptions for calculated examples: three-phase balanced AC supply, 95% charger efficiency, 0.98 power factor, and nominal 400 V or 480 V line-to-line voltage. Values are engineering planning examples, not a substitute for the charger manufacturer’s certified data, utility requirements, or the applicable electrical code. | ||||
Commercial DC charging can strain a building’s electrical capacity during busy periods. A 150-kilowatt charger may overlap with elevators, refrigeration, or HVAC equipment. Smart charging prevents every vehicle from charging at full power simultaneously. It assigns power according to departure time, battery level, and site limits.
In practice, the system needs accurate data. Meter readings should update every few seconds, not once an hour. Energy management software can compare charger demand with the building’s current load. When demand rises, charging power can be reduced gradually. Vehicles still charge, but the site avoids sudden peaks. A clear priority rule helps: emergency fleet vehicles may charge first, while flexible vehicles wait.
Demand control adds another protection layer. Set a maximum import threshold below the utility limit, leaving room for measurement errors and unexpected equipment starts. The control system should send alerts before reaching that threshold. Operators also need manual override access during unusual events. Automation is useful, but it is not infallible.
I have seen charging schedules fail when employees enter inaccurate departure times. Simple screens and short staff training can improve the data. Testing should include winter HVAC loads, low battery arrivals, and simultaneous departures. Maintenance teams should review monthly peak demand, charging delays, and user complaints. A slightly conservative schedule may reduce revenue, yet an aggressive one can trigger expensive demand charges. That trade-off deserves regular review.
Commercial DC charging works best when operators treat it as an active energy system, not a simple plug-in service. Monitor charger output, session duration, power demand, and fault history each day. Compare these readings with building load data. This reveals whether charging overlaps with HVAC peaks or production schedules. A clear dashboard can expose small losses before they become expensive problems. Keep records. They support safer decisions and more reliable maintenance.
Tips: Set charging limits during peak demand. Check cable temperature during busy periods. Review error logs weekly. Use calibrated meters and approved testing procedures. Ask a qualified electrician to inspect protective devices and connections.
Infrastructure needs practical attention. Inspect connectors for heat marks, moisture, and mechanical damage. Clean ventilation paths and keep equipment away from stored materials. Thermal scanning can identify loose connections that ordinary visual checks miss. Preventive maintenance usually costs less than emergency repairs. Still, no maintenance plan is perfect. A missed inspection can disrupt several vehicles at once.
Efficiency also depends on user behavior. Encourage drivers to avoid unnecessary idle time after charging finishes. Schedule vehicles according to departure needs, rather than charging everything simultaneously. Simple load management can reduce demand spikes without reducing daily mobility. Review performance monthly and adjust settings carefully. A lower power limit may improve stability, but it can also extend charging time. Test changes on a small group before wider deployment.
Review the utility service rating, transformer capacity, switchgear limits, and spare breaker positions. Check cable routes, protection settings, ventilation, and nearby installation space. A crowded panel can hide capacity problems.
They show how office equipment, elevators, HVAC, refrigeration, and lighting affect demand. A charger may seem safe at noon but create a peak at 5 p.m. Meter data beats guesses.
Record arrival times, departure deadlines, daily mileage, and energy needs. Delivery vehicles may require rapid charging. Employee vehicles can often charge during longer parking periods.
It staggers charging sessions instead of charging every vehicle at full power. Power can follow battery level, departure time, and site limits. Vehicles still charge.
Set a maximum import threshold below the utility limit. This leaves room for measurement errors and unexpected equipment starts. Add alerts and manual override access.
Use accurate departure times, battery levels, and current building demand. Simple screens and short staff training can reduce incorrect entries. Bad data creates bad schedules.
Track charger output, session duration, power demand, and fault history daily. Compare charging data with building load data. Review error logs weekly.
Inspect connectors for heat marks, moisture, and mechanical damage. Clean ventilation paths and keep equipment away from stored materials. Thermal scanning can reveal loose connections.
Limit power during peak demand and avoid unnecessary vehicle idle time. Test new settings on a small group before wider deployment. Lower power may improve stability, but charging can take longer.
Real behavior rarely follows the original spreadsheet. Fleet growth, colder weather, and delayed departures can change demand quickly. The first estimate may be wrong.
Learning how to optimize dc charging for commercial buildings begins with understanding the facility’s energy needs, vehicle usage patterns, and charging objectives. Building owners should evaluate available electrical capacity, daily load profiles, peak demand periods, and the expected number of vehicles requiring fast charging. This assessment helps determine the appropriate charging capacity while reducing the risk of overloads, costly infrastructure upgrades, or inefficient energy use.
The next steps include selecting suitable DC charging equipment and designing a reliable power distribution system with room for future expansion. Smart charging schedules, energy management controls, and demand-limiting strategies can balance charging needs with other building operations and help lower peak electricity costs. Continuous monitoring is also essential for tracking performance, identifying faults, and measuring energy efficiency. Regular inspections, preventive maintenance, and periodic system adjustments can improve reliability, extend equipment life, and ensure that the charging network continues to support the building’s operational and sustainability goals.

LA Charger